Welcome to Data Analysis for Neuroscientists II
Today we will be looking in more detail at some common Matlab tasks that will come up repeatedly in the data analysis course
Using this tutorial
The command prompt
>>indicates stuff you should type in to MATLAB.
Where there is a ? you can click to reveal the answer.
- Try to work out a solution and try it out in MATLAB before you reveal the answer.
Writing following a % sign, usually green text, is a comment.
- You don't have to type these into Matlab - they are my comments for you to read, to clarify what we are doing
Download the data files
Download the text files:
...and put them into your default Matlab directory
Each of these files contains a table with historical weather data.
First, find out which directory you are working in by opening matlab and typing
>> pwd
This command tells you where your default Matlab directory is (pwd stands for 'present working directory', which is where you will be when you first open Matlab).
Look at the data
Let's start with the Oxford data
- Load the Oxford data
- Have a look at the data
- The table contains 7 columns. These are, in order,
- year
- month
- avg max temperature that month (°C)
- avg min temperature that month (°C)
- number of days with air frost that month
- total rainfall that month (mm)
- total sunshine hours that month
- It will be easier for you to read the table if you tell Matlab *not* to use scientific notation (eg, write 999 instead of 9.99e2)
>> oxweather = load('oxfordWeather.txt');
>> oxweather % display the contents of matrix/variable called 'oxweather'
>> format shortg % switch off scientific notation
>> oxweather % display the table again
What is the earliest year from which we have records?
?Get Matlab to display the first 24 lines of the table (the first 2 years of data)
?You may notice that in the 7th column (sunlight hours) there is no number, but a NaN
NaN stands for not a number.
It is a placeholder for cells in a matrix where the data value is missing
There are no sunshine data for the first few years, because the sunshine measuring instrument was not installed yet
Scroll through the data and find out when the instrument was installed
Why don't we just use a zero where the data value is missing?
?
Indexing data
One of the most basic things I might like to do is to find data points that match some criterion.For example, I might like to know in which years and months the maximum daily temperature was below freezing
To do this I can use the find function to generate a set of indices. I will store the indices in a vector I call ix
>> ix = find(oxweather(:,3) < 0)That gave me the line numbers in the table for the cold months when maximum daily temperature was below freezing. How can I use this to find out which years and months this happened in?
HINTANSWERUse the technique above to identify the years/months with an average max temperature over 25°C.
As you can see it is pretty rare that we have sustained periods of really hot or cold weather. Depending where you are from, you may not consider 0°/25°C really cold or hot at all.
We do though.
How many of the years you identified can you spot in this list of official natural disasters?I particularly like the fact that 'heatwave' summers where the average max temperature was over 25 degrees are considered so extreme that they are displayed in the same table as the Black Death and the Potato Famine...!
More on indexing matrices can be found in the Stormy Attaway book, Chapter 2, especially p33-44.
Scripts
A script is a text file (with a filename ending in .m) containing a list of commands you would like MATLAB to execute.
Running commands from a script is essentially The Same as running them directly from the command line.
For example, say you wanted to make separate matrices for rainfall data and sunlight data.
You could type on the command line:>> rainfall = oxweather(:,[1 2 6])
>> sunlight = oxweather(:,[1 2 7])
Equally, you could have typed the commands above into a script and saved it as getRainSun.m.
>> GetRainSun.m
>> oxweather = load('oxfordWeather.txt')
>> rainfall = oxweather(:,[1 2 6])
>> sunlight = oxweather(:,[1 2 7])
Then you could run the script, either by clicking the "run" button, or typing
>> clear; % clear the workspace first so you know the variables are not the same ones you created before!
>> getRainSun % note you don't type .m when running the script
In your workspace you should have three matrices - oxweather, rainfall and sunlight.
So why use scripts?
Since running commands from a script is the same as typing them on the command line, why do I keep getting you to write scripts? The reasons for using a script are mainly to do with convenience and record-keeping:
- Record keeping
- You can see exactly what commands you ran, so it is easier to find errors.
- You can always check later (even months later) exactly what you did - this is really important when you are working with real data and want to publish some statistical result - you want to be sure how you obtained it, and your colleagues/supervisor may want to see exactly how you obtained it as well!
- Accuracy & efficiency
- You can execute whole series of commands quickly and repeatedly (so you can save a lot of time by scripting standard data analysis routines)
- You wont make a mistake when repeating data analysis on many data sets, because you don't have to retype the commands each time
- Loops
- Some commands, like for loops, can be too long and complex to type directly on the command line without making a mistake
- If there is an error in a script, MATLAB will tell you which line it is on - if you try to run directly from the command line you don't get this feedback.
>>> More on scripts in the Getting Started Guide, section on 'flow control'
>>> More on scripts in the Stormy Attaway book chapter 3
The for loop
Say I want to find out the mean hours of sunlight in each month (January-December). This is probably going to involve doing some calculation 12 times (once for each month). This can be done efficiently using a loop, as we shall now see.
First of all, how would you find out the mean number of sunlight hours in October?
?Now, if I want to repeat the process for each of months 1-12 (ie, January to October) I can do it using a for loop:
?You can have a look at the results by printing the matrix meanSunlight to the command line
?What is the mean number of sunlight hours in June? What about in January?
?You can spot patterns in the data more easily if you plot them
?Did the hours of sunlight vary with month in the way you expected?
More exercises
Load the Cambridge and London weather data into matrices called camweather and uclweather
Use/modify your for loop to get plots for the mean sunlight hours at Oxford, Cambridge and UCL
You can us the hold on command to get these plots on the same graph
Plot them in different colors: Oxford blue ('b'), Cambridge blue ('c') and UCL black ('k')
Use/modify your for loop to get plots for the mean rainfall in each month at Oxford, Cambridge and UCL
Given the above plots, should you really have come to study here?!
The for loop again
Let's look at the for loop in more detail.
You made a for loop that went through the months 1-12 (January-December) and found the mean sunlight hours for each month, and stored them in elements 1-12 of a matrix meanSunlight
This was a special case of a for loop, in which the variable month played three roles:
As a counter variable
- we wanted to process 12 months, so we asked the for loop to run for month = 1:12
To tell us which rows to pull out if the input matrix
- when month was 1, we searched for rows where oxweather(:,2)==1
- when month was 2, we searched for rows where oxweather(:,2)==2
- ...
- when month was 12, we searched for rows where oxweather(:,2)==12
As an index to the output matrix - so
- when month was 1, the mean hours of sunlight were stored in meanSunlight(1)
- when month was 2, the mean hours of sunlight were stored in meanSunlight(2)
- ...
- when month was 12, the mean hours of sunlight were stored in meanSunlight(12)
To understand the distinction between these roles, first imagine we are only interested in sunlight hours during the punting season (optimistically advertised as March-October by the Cherwell Boathouse)
What would the for loop look like?
?In general, we probably want our output matrix to contain only the data we are interested in, so we might want to dissociate the counter variable, the input variable, and the output variable.
HELPTo test whether you understood this, let's try another case. Can you get the total rainfall in each of the years 1981-2015?
?>>> More for loops in the Getting Started Guide, sections 5-2 to 5-8
>>> More for loops in the Stormy Attaway book chapter 5 (p148-162)
The while loop
In Matlab (and most programming languages) there are two types of loops, for and while.
We will be using mainly the for loop in this course, but for the sake of completeness we will have a quick look at the while loop here.
To illustrate the difference between for and while loops, we will make a script that rolls a 'virtual dice'.
To simulate one dice roll, we can use the random number generator randi to generate a random integer between 1 and 6.
- Use help randi to work out how to do this
?Can you make a for loop that rolls the random dice 10,000 times and saves the outcomes into a vector called dicerolls?
?Can you modify this script to roll two dice on each trial instead of one?
?Plot three histograms for the outcomes for each dice individually, and the sum of the outcomes on the two dice, using the function hist
?Now let's try something different. Say I'd like to simulate rolling the dice until we get a six, and record how many rolls were required. How am I going to do that?
One option is to use a while loop.
?Let's think in more detail about the differences between the for and while loops.
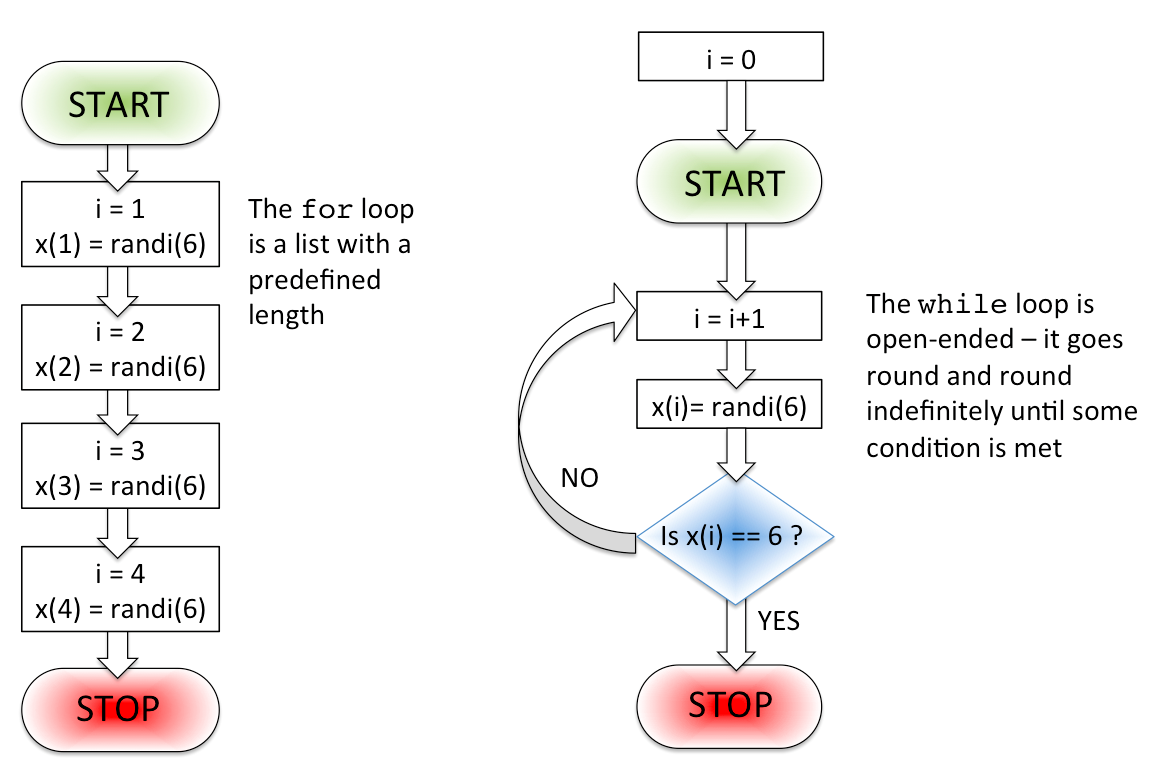
The difference between for and while loops is how we determine when to stop going round and round the loop.
In the case of the for loop, we have a predefined number of passes through the loop - one for each listed value of the counter variable. So a loop that rolls a virtual "dice" 4 times might look like this:
>> for i=1:4
>> x(i) = randi(6);% roll a virtual dice by picking a random integer from 1 to 6
>> endI know that I will have to pass through the for loop 4 times:
... and then stop.
- On pass 1, i=1
- On pass 2, i=2
- On pass 3, i=3
- On pass 4, i=4
You can think of the for loop as a kind of list, where everything it needs to do is laid out in advance.
In contrast, a while loop doesn't have a predefined list of iterations. It loops round and round indefinitely until some criterion is met.
>>> More while loops in the Getting Started Guide, section 5
>>> More while loops in the Stormy Attaway book chapter 5
Exercises
Say I would like to find out the distribution of the number of dicerolls needed to score a 1 for dice with 4,6,8,12 and 20 sides (these are the only dice shapes that are Platonic Solids - see Wikipedia if intrigued!)
Can you modify your while to simulate rolling the 4 sided dice until I get a 1?
?Why am I using the number 1 not the number 6 here by the way?
?Now, I would like to find out the distribution of the number of rolls needed to score a 1 on each dice.
To do this I will need to roll each dice until I get a 1 lots of times. Think of this as an experiment with 10000 trials. On each 'trial' I roll the dice until I get a 1, and the outcome of the trial is the number of rolls requires.
My while loop runs one trial.
Can you figure out how to make 10000 trials by embedding the while loop in a for loop?
?Run the whole experiment for each of the Platonic dice and in each case plot a histogram of the number of rolls needed to get a 1.
What is the most common number of rolls needed for each dice?
What do you notice about the distributions for the different dice?