Data Analysis for Neuroscientists III:
Standardized Scores
How unusual is my sample?Let's start by generating two simulated 'datasets' iq and h with 1000 data points in each:
You can do this using the function randn which generates normally-distributed random numbers with a mean of 0 and a standard deviation of 1 HINT ?
Now then. |

Eric |
Distance from the mean
How much higher is Eric's IQ (130) than the population mean?
?
How much taller is Eric (height 195cm) than the population mean?
?So we know that Eric is x IQ points higher than the population mean, and y cm taller than the population mean.
How can we compare these two values to figure out which is more unusual, his height or his IQ??Standardized differences
What is the standard deviation of IQ scores in the population?
What is the population standard deviation of men's heights??So how many standard deviations from the mean is Eric's height?
?...and what about his IQ?
?So which is more unusual?
?Error bars
You will sometimes hear one scientist berating another for showing data without error bars.
In relation to the work you have just done, why do you think this is?
?The Z score
Measuring the deviation of a sample in terms of how many standard deviations it is from the mean gives us a common currency for comparing how unusual samples are.
The number of (population) standard deviations a sample lies from the (population) mean is such a useful statistic that it has a name - the Z score.
Can you write down a formula for the Z-score?
?The definition of the Z-score is the distance of a point x from the mean μ of a normal distribution, in units of the standard deviation of that normal distribution, σ
We can also think about the Z-score as 'mapping' a point in our data distribution to another, well known distribution - the Standard Normal Distribution.
The Standard Normal Distribution
What is the mean Z-score for the 1000 Heights in our sample?
What is the standard deviation of the Z-scores?
?Do the same for the 1000 IQ samples.
What are the mean and standard deviation of the Z-scores in this case?
Hopefully, you should have found that in both cases:
- The mean Z-score is about zero
- The standard deviation of Z-scores is about 1.
Can you see why this is, from the equation for the Z-score?
In fact, because out height and IQ data were normally distributed (we made them that way - remember we generated the "data" using using randn), the process of converting the height/IQ values to Z-scores transforms their distribution to another normal distribution, with mean = 0 and standard deviation = 1.
This is called the Standard Normal Distribution.
It is the distribution from which the function randn draws numbers.
We can plot a Probability Density Function (PDF) for the standard Normal distribution using normpdf.
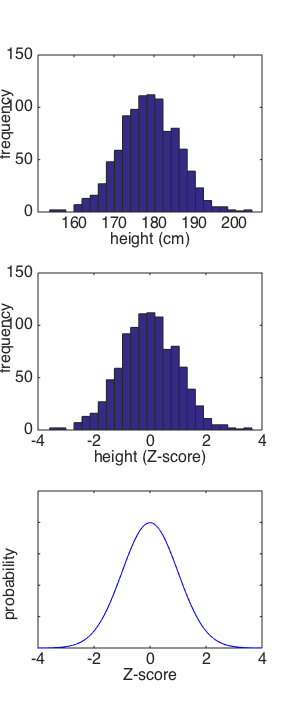
DIVERSION - skip if short of time! and just look at this one instead -->Right. After that diversion into the world of plotting graphs, let's take another look at that plot of the standard Normal distribution.
And let's also compare that to the distribution of heights in our "sample" of 1000 men, and the distribution of Z-scores for heights. You can nicely see the distributions of those data if you plot a histogram of them using hist
?
Probability of observing a given value
Say I want to know how likely it is that if I test somebody's IQ, they will be at least as smart as Eric (who as you no doubt remember, had an IQ of 130).
Last week, we calculated how many people in our sample had IQs of at least 130, using logical operators. Can you remember how to do this?
- How many people in the current "sample" have IQs of at least 130?
Have a look at the histogram of raw IQ scores. How could you work out the proportion of subjects with IQs of at least 130 from this histogram?
?
Now, by analogy, we can use the Standard Normal distribution to work out the probability that someone has an IQ of at least 130.
First, we work out the Z-score corresponding to an IQ of 130.
Then, we find the area under the curve, to the right of this Z-score.
Because the area under the curve for the whole standard normal distribution adds up to 1, the proportion of it the right of a given Z-score gives the probability of observing a Z-score of at least this value, in the same way that the sum of the heights of the bars on the histogram gave the proportion of the 1000 men who have IQs of at least 130.
Conveniently, MATLAB has a function that will work out the area under a normal distribution for you. It's called normcdf.
Use normcdf to work out the probability of obtaining a Z-score of:
- Z > 3.1
- Z < -1.96
- Z > 2.3
- Z < 2.3
?Because the area under the curve to the left/right of these Z-scores tells us the probability of obtaining a Z-score at least that small/large, these areas define the p-values corresponding to those Z-scores.
Hopefully, the Z-scores you just looked at correspond to some nice round-numbered p-values (you may need to round them to two significant figures).
- Which commonly used significance tests do the Z-values correspond to?
- Which actual values (in cm/ IQ points) do the Z-scores correspond to?
Interpretation of Z-scores
Here are the heights of some more men:
181 173 175 169 174 182 190 171 181 182
Work out their Z-scores, using only one line of code.
?Some of those Z-scores are negative! What does that mean?
Non-normal data
As you have seen, the Z-score relies on our ability to map our data onto the standard normal distribution, just by changing the values on the x-axis
What if the data are not normally distributed in the first place?
Reaction time data
Go to the website humanbenchmark.com and test your reaction time!
- I particularly like the high score board, on which the top two people have RTs of exactly 100ms
- This is ridiculously fast!
- US Navy Top Gun fighter pilots typically score between 200 and 225 milliseconds
- I think they programmed their computers to beat the test
- But I like the fact that number 2 is accusing number 1: "is cheater"!
Take a look at their statistics page where they show a histogram of 600,000 RTs that people generated in the last month
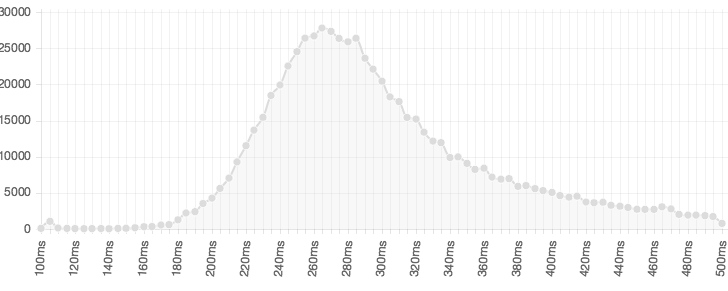
Where would your RT fall on this curve?
I captured the data from the image and made the into a text file, RT.txt.
- Download the data
- Load them into Matlab as a matrix called RT
- What do you think is in the two columns of RT?
?- Can you make a plot of the data that looks similar to the one above?
?Getting the mean and standard deviation
What are the mean and standard deviation of reaction times?
To work this out you need to use the formula for expected value (the mean) in terms of :
- Values (100ms, 105ms, etc)
- Frequencies (405 suspect clicks at 100ms, 1198 suspect clicks at 105ms etc)
?- You will also need the equivalent formula for standard deviation
?Ok, tell me the answer!
?Z-score your data
Now you know the mean and standard deviation, you can convert your RT into a Z-score.
The problem
RT data are notoriously non-normal.
What RT value is 2-standard deviations below the mean? ?What RT value is 2-standard deviations above the mean? ?How many RTs were recorded more than 2 stdevs below the mean? ?How many RTs were recorded more than 2 stdevs above the mean? Clearly, for these non-normal data, Z-scores do not tell us how unlikely a given observation is!
Log Transform
In the lognormal distribution, the log of the data values follows a normal distribution.
So if we take the log of each RT value, the resulting log transformed values log(RT) should be normal distributed.
Calculate the log-transformed RTs for the given data and plot them.?
- Is the distribution roughly normal?
- What is the mean of the logged RTs? is this the same as the log of the mean of the RTs?
?- What is the standard deviation of log(RT)?
Hopefully you are convinced that the log RTs are close to being Normally distributed than the raw RTs were.
- What are the log-transformed equivalents of the RTs we found to be 2 stdevs above and below the mean?
- Can you find the Z-scores these log transformed values?
Hopefully, the Z-scores are no longer the same size. It is now apparent that the lower RT is more unusual.
Log transforming data is a common trick to make right-skewed data approximately normally distributed.
Probability Matching (no exercises in this bit)
Log transforming data is a helpful trick for making right-skewed, positive data more Normal.
There is a more general approach for mapping non-Normal data onto a normal distribution though: probability matching.
This image illustrates the concept of probability matching for two probability density functions (probability distributions adjusted so that the area under the whole curve adds up to 1).
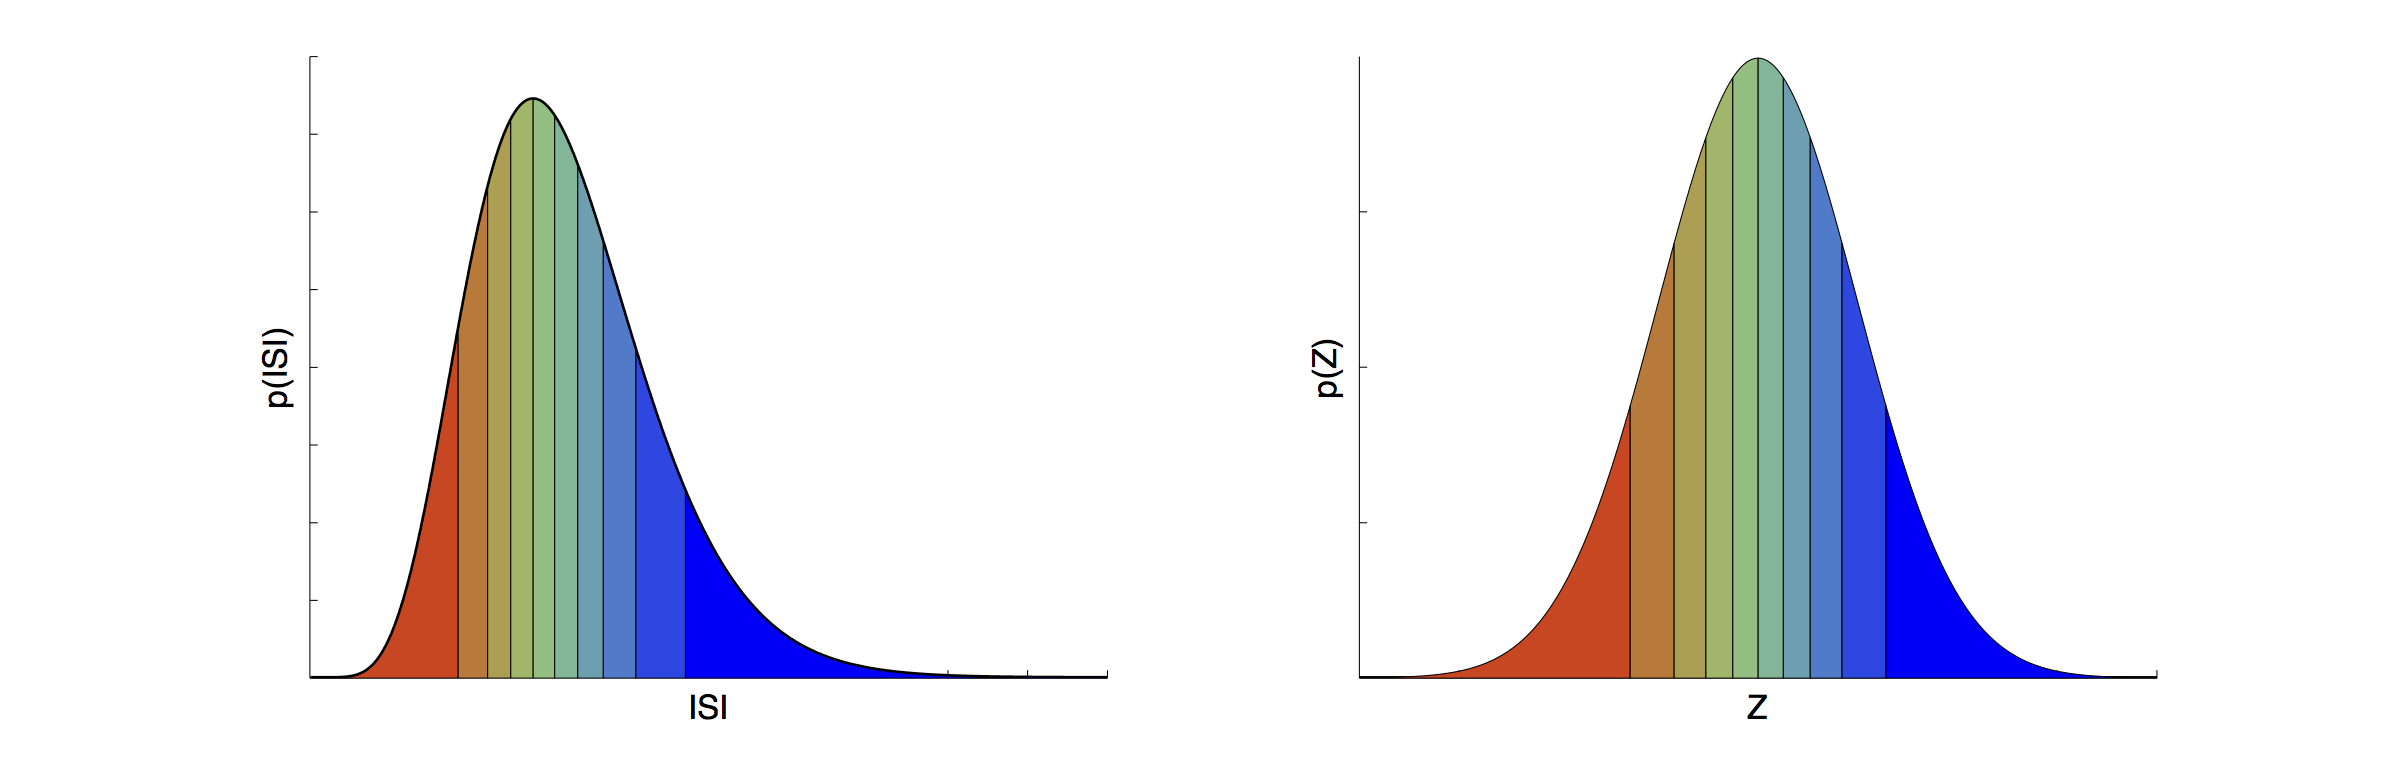
On the left we have a distribution of Inter-spike Intervals that is heavily right skewed. On the right, we have a Standard Normal Distribution.
For any probability density function, the area under the curve of the distribution, between two values on the x-axis, gives the probability of observing a data value in that range. In the case that we are looking at the area in the tail of the distribution (area under the curve from the edge of the distribution to some value X) the area under the curve is the same a the p-value for X.
I have sliced the probability distribution up into slices of equal area.
As you can see, the spacing of the slices on the x-axis is not even, and is not the same for the two distributions.
But hopefully you can see intuitively that the boundaries between slices correspond to the same p-values in both cases. So matching the boundaries between slices of equal area gives a natural "mapping" or transformation between the two distributions.
This is a Probability Matching transformation and is commonly used in data analysis packages - normally to convert non-Normal data to a Normal distribution so that Normal-assumption statistics like Z-scores and t-tests can be used.
For example, the Oxford fMRI analysis package FEAT makes use of probability transformations so that "activation levels" can be reported as Z-scores.
Extra Exercises
Pick and choose - you won't have time for all of them
Plotting Data
If you skipped the 'diversion' earlier and now have time, go back and do that exercise
You can find more material about plotting data in the MATLAB primer section on plotting data (Section 4).
- In particular, sections 4-2 to 4-15 would be relevant to what we did today.
- Section 4-19 shows you how to make some cool looking plots.
- The other stuff on saving figures etc is a little boring but is useful reference material (ie it's good to know where to find it if you need it, but you might not want to sit and work through it now).
There is more fun to be had in Stormy Attaway, chapter 11, including animations!
Writing functions in MATLAB
Can you write a MATLAB function zscore that takes in:
and returns the Z-score, Z?
- a value x,
- population mean μ
- population standard deviation σ
You can read about MATLAB functions in:
If you are not sure how to tackle this, please work through that section first rather than just looking at the answer!
- The MATLAB Getting Started guide, section 5-11
- Stormy Attaway Chaper 3, especially section 3.7
?You can test your function on Eric's data. If you do:
>> myzscore(195,179,7)Do you get the answer you expect?
Probability Integral Transform (advanced)
I have thrown in a difficult exercise here on probability matching. This is more one for any computationally-savvy students who have whizzed through the rest already.
It is quite long so I have hidden it behind a click. Otherwise people reading the main text will get a false impression of how much there is to get through.
HIT ME!
