Imagine we put a hungry rat in an operant box designed so that the rat has to press a lever a certain
number of times to get a pellet of food.
We might propose a model in which that the number of times c the rat is prepared to press the level to get the pellet
is proportional to the square root of the time t since it last ate.
For example say that:
p = 5 + 4
Plot the predicted number of lever presses a rat will do, for times 0-12 hours after it last ate, at 30min intervals.
?
>> t = 0:0.5:12;
>> p = 5 + 4.*sqrt(t);
>> plot(t,p)
Now, load the data file leverpress_data.txt into a variable data. In the first column of this file,
we have the time since last meal. In the second column, we have the number of leverpresses the
rat performed.
Plot these data.
?
>> data = load('leverpresses.txt');
>> t = data(:,1); % times
>> p = data(:,2); % number of presses
>> plot(t,p,'.')
Hopefully, you can see that a straight-line relationship...
p = β0 + β1t
....between t and p is not going to be a good fit, especially at short time intervals.
Just out of curiosity though, fit one and plot the line on the graph.
?
>> ratstats = regstats(p,t)
>> b0 = ratstats.beta(1);
>> b1 = ratstats.beta(2);
>> pfit = b0 + b1.*t;
>> plot(t,p,'.'); hold on;
>> plot(t,pfit,'-');
Replacing the explanatory (independent) variable
If we want to do fit a linear regression model to this data, how do we do it, given that y depends on
, not on t directly?
Easy! Define variable s =
Then we can write down our regression equation as follows:
p = β0 + β1s
Now if we plot p as a function of s rather than t, we should get a nice straight line!
For example say that:
p = 5 + 4
- Plot p against the square root of t.
?
>> t = 0:0.5:12;
>> s = sqrt(t);
>> p = 5 + 4.*s;
>> plot(s,p)
or you could have just done:
>> t = 0:0.5:12;
>> p = 5 + 4.*sqrt(t);
>> plot(sqrt(t),p)
- Fit a regression line to p and
?
>> b = glmfit(sqrt(t),p)
>> pfit = b(1) + b(2).*sqrt(t);
>> plot(sqrt(t),p,'.'); hold on;
>> plot(sqrt(t),pfit,'-');
- Plot the data p and the fitted values pfit against
?
>> plot(sqrt(t),p,'.'); hold on;
>> plot(sqrt(t),pfit,'-');
- Plot the data p and the fitted values pfit against t itself
?
>> plot(sqrt(t),p,'.'); hold on;
>> plot(sqrt(t),pfit,'-');
Ta-da!!
In some cases of multiple regression, one of our explanatory variables may be binary.
For example, say the firing rate of a cell depends on the intensity of a light stimulus,
but also on whether the animal is paying attention to the light stimulus or not.
Then we can write the regression equation:
r = β0 + β1log(x1) + β2x2
... where x1 is the light intensity and x2 is a binary variable that takes value 1 if the animal was attending to the
light, and 0 otherwise.
Load the file attention_intensity.txt into a matrix called data
- Column 1 contains the stimulus light intensity values, x1
- Column 2 contains the value of x2 - whether the animal was attending or not
- Column 3 contains the firing rate of the cell
Try plotting the firing rate against the light intensity, disregarding the attention variable.
?
>> data = load('attention_intensity.txt')
>> plot(data(:,1),data(:,3),'.')
Hopefully, you can see that the data might be better fit by two regression lines than by one.
This might be even clearer if you plot the "attended" and "unattended" stimuli in different colours.
?
>> data = load('attention_intensity.txt')
>> att = find(data(:,2)==1) % find the rows corresponding to attended trials
>> unatt = find(data(:,2)==0)
>> plot(data(att,1),data(att,3),'b.')
>> hold on
>> plot(data(unatt,1),data(unatt,3),'r.')
Try fitting a regression model to the data, using glmfit as usual
?
>> betas = glmfit(data(:,1:2),data(:,3))
You should have three regression coefficients in the vector betas - the constant term, and the coefficients for
the light intensity x1 and the attention variable x2.
Plus the regression coefficients back into the equation. Because this is a multiple regression, you could
consider plotting the relationship of firing rate to x and a on a 3D plot. But because the attention variable is binary,
you could also just add two regression lines, for the attended and unattended conditions, to your scatter plot.
?
>> b0 = betas(1);
>> b1 = betas(2); % reg coeff for firing rate
>> b2 = betas(3); % reg coeff for attention variable
>> x_axis_vals = 1:100
>> rfit_att = b0 + x_axis_vals.*b1 + b2; % b2 is effectively a constant that we add on in attended trials
>> rfit_unatt = b0 + x_axis_vals.*b1 ;
>>
>> plot(x_axis_vals, rfit_att, 'b-')
>> plot(x_axis_vals, rfit_unatt, 'r-')
In summary, a binary explanatory (independent) variable is treated just like a continuous explanatory variable.
But when plotting the data, you may not need to go for a full 3D plot, since the binary variable
takes only two values (0 and 1) and so a 2D plot with 2 separate lines contains the same information
as the 3D plot would.
One application of linear regression is in fMRI analysis.
Typically, we would analyse fMRI data using a software package like FSL or SPM. These packages
do all sorts of fancy stuff like pre-processing the data to improve signal to noise, registering to
a standard space, correcting scanner distortions etc etc.
But the core of the actual statistics done by SPM, FSL and co is linear regression. I thought
it might be informative to have a look at a linear regression in the context of the fMRI
data we collected.
Remember in the fMRI practical, we asked our friendly volunteer to complete some sums of varying
difficulty (adding numbers with 1, 2 or 3 digits).
The task was organised such that the volunteer did sums at one difficulty level for 15s, then
rested for a few seconds, then did sums at another difficulty level for 15s. In fMRI analysis, we are
interested in finding brain regions where activity varies over time, in synch with the difficulty
of the sums.
Download the file sums_timings.txt and load it into MATLAB as a matrix raw_timings.
?
>> raw_timings = dlmread('sums_timings.txt')
Take a look at raw_timings. In this matrix we have:
- Columns 1 and 2: The actual digits the volunteer added up on each trial
- Column 3: The time the trial was presented, in seconds since the start of the experiment
- Column 4: The difficulty level (1,2, or 3, meaning easy, medium or hard).
Make a graph with time on the x-axis, and one dot per trial, with y-value 1,2, or 3 for
easy, medium and hard trials.
?
>> plot(raw_timings(:,3), raw_timings(:,4), 'o');
Now, I would like to model brain activity as being "on" during the blocks, and bigger on harder blocks.
Also, I have a measurement of brain activity only once every 3 seconds (due to the low temporal
resolution for fMRI).
Download the file difficulty_blocks.txt and load it into MATLAB as blocks. In this
file, I have put:
- Column 1: the time in seconds at which each brain measurement was made (ie once every 3s)
- Column 2: the difficult of the sums being done at that moment:
- 1,2,3 for easy, medium and hard
- 0 for rest blocks
Normally, FSL or SPM would generate this from the timings of the events themselves.
Plot the moment-by-moment difficulty given in blocks on the same graph as the individual trials.
You might want to use a line, rather than dots, in this case, as we are modelling something
that is continuous over time.
?
>> blocks = dlmread('difficulty_blocks.txt');
>> hold on;
>> plot(blocks(:,1), blocks(:,2), 'b-');
Now, the BOLD response does not track the brain activity and the task in real time - there is
a delay and smoothing factor caused by the Haemodynamic Response Function. I have therefore
made another matrix (saved as difficulty_blocks_convolved.txt) which contains the time at
which each brain measurement was made, and the predicted signal based on task difficulty
convolved with the hrf.
Normally, FSL or SPM would make this for you.
Load difficulty_blocks_convolved.txt as blocks_conv and add the predicted signal to the graph,
perhaps as a red line this time.
?
>> blocks_conv = dlmread('difficulty_blocks_convolved.txt');
>> hold on;
>> plot(blocks_conv(:,1), blocks_conv(:,2), 'r-');
Hopefully you can see the relation between the three things plotted on the graph:
- The actual trials
- The blocks of (predicted) brain activity
- The blocks of (predicted) fMRI signal after convolution with the HRF
Now it's time ot load up some fMRI data and run the regression!
Normally, we would run the regression for each voxel in the brain, searching for voxels that are a
good fit to our model (the red line on your graph). For the purposes of this tutorial, I have
picked out a couple of individual voxels for you to have a look at.
Load mystery_voxel_1.txt as vox1. This file contains a column with the time at which
the data were recorded (which should match the times in blocks_conv) and the BOLD signal from
our Mystery Voxel at these times.
Start a new figure and plot the fMRI data against the time they were recorded.
?
>> vox1 = dlmread('mystery_voxel_1.txt');
>> figure; hold on;
>> plot(vox1(:,1), vox1(:,2), 'k-');
This looks hopeful! The BOLD signal does look a bit like our predicted signal blocks_conv.
However, the actual y-values are really different - since the BOLD signal values are in the
range 12000-13000, and the blocks_conv values are in the range 0-3.
Run a linear regression with blocks_conv(:,2) as the independent variable, and
the fMRI data (vox1(:,2)) as the dependent variable.
?
>> b = glmfit(blocks_conv(:,2),vox1(:,2))
- Find the predicted dependent-variable values (the predicted BOLD signal)
from the values of the dependent variable x (i.e., the values of blocks_conv)
and the fitted values of slope β1 and constant term/ y-intercept β0
?
>> yfit = blocks_conv(:,2).*b(2) + b(1)
- Add the fitted fMRI signal to the plot with the real fMRI signal
?
>> hold on;
>> plot(blocks_conv(:,1),yfit,'r-'); % note the x-axis values are the times of the brain measurements
not bad eh?!
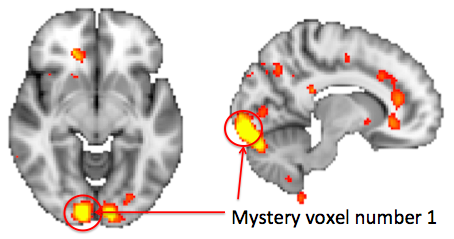
Data in this voxel were beautifully fit by the difficulty of the sums. Where do you think the voxel was
in the brain? Maybe dorsolateral prefrontal cortex? Or perhaps the superior parietal lobule?
?
Uh-oh. It's the primary visual cortex!! Why would activity here fit the difficult of the sums so nicely?
HINT:
ANSWER:
There was more visual stimulation for the 3-digit sums than the 1-digit sums. Oops!
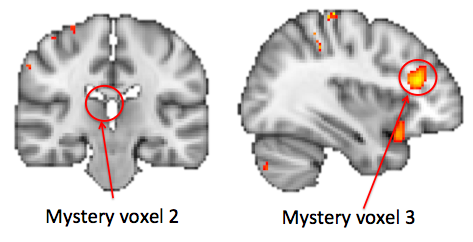
Fear not! I have provided two more mystery voxels, mystery_voxel_2.txt
and mystery_voxel_3.txt. One of these
is genuinely in the dlPFC and is genuinely interested in the difficulty of sums (although, sadly,
with a lower significance level than the first Mystery Voxel). The other one is in the ventricle
so should really not have any task-related signal.
Repeat the analysis procedure above and work out which mystery voxel is which!
?
Regression on timeseries vs. non-timeseries data
Now then - you may be thinking that the regressions we have done on the fMRI data don't look much like the regression in the first
part of the tutorial.
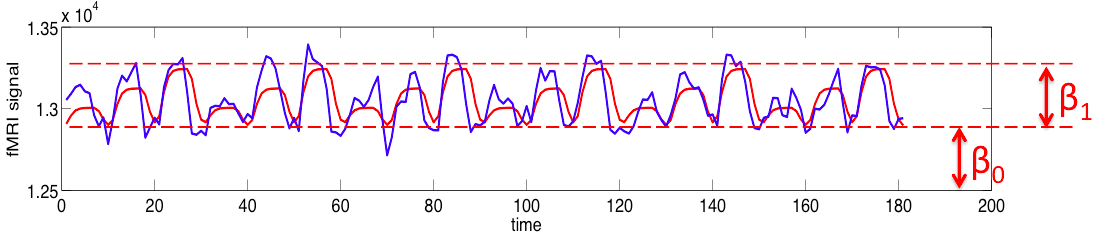
In the case of the timeseries data, it looks like we are fitting the shape of some predicted signal
(those blocks of activity of varying intensity) to the shape of actual brain activity over time.
How does this relate to the slope and y-intercept of a regression line?
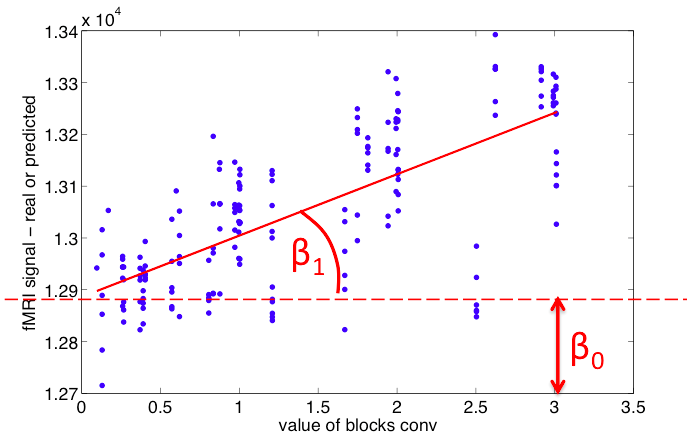
To understand this, it might help to just plot our dependent and independent variables for
the fMRI data on a scatter plot, like we did for the simulated data in the first part of the tutorial.
- Make a graph with the values of the independent variable, blocks_conv, on
the x-axis, and the values of the fMRI signal vox1 on the y-axis.
- Plot each data point as a dot on this graph
?
>> figure; plot(blocks_conv(:,2), vox1(:,2), '.');
You are only plotting the values of x and y at each timepoint -
so you only need the second columns of each matrix.
The first column just contains the times at which these data were recorded, which were used to
match the x and y values to each other, but are now irrelevant.
- Plot the regression line using the fitted values of the slope and y-intercept.
?
>> b = glmfit(blocks_conv(:,2), vox1(:,2));
>> x = blocks_conv(:,2)
>> hold on; plot(x, b(2).*x + b(1), 'r-');
So the temporal regression of the fMRI data can be plotted just like an ordinary regression
with a slope and a y-intercept. The relation between the two ways of looking at the data is
illustrated below:
When doing regression on timeseries data, both of these ways of thinking about the regression can be helpful.