You will need:
- Your zip disk containing data used in the practicals so far
- A computer with internet access
- MapInfo software (at least version 5.5)
|
|
Open MapInfo. In the Quick Start dialogue box select Open a Workspace and press the Open button. Select the workspace compart.WOR and
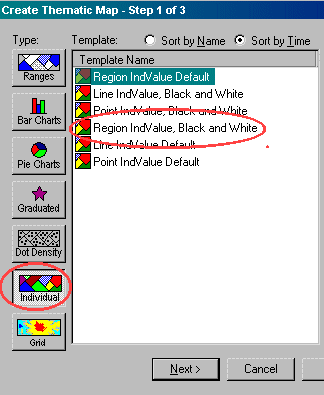
click Open. In order to create a thematic map the mapper window needs to be active. To do this, click on the title bar of the mapper window. Select the Map menu and Create a Thematic Map... The Create a Thematic Map dialogue box will appear. Under Type click on the Individual button. In Template Name select Region IndValue, Black and White. If you have a colour printer available as an alternative you could choose Region IndValue Default. Then click on Next.
|

|
The next step is to Select a Table and a Field. Under Table select compart_info_now and under Field select Species. This is the variable you want to display in the thematic map. When you are finished entering this information click on Next.
|
|
In Step 3 click on the Legend... button. The Customize Legend dialogue box will appear. Most of the information will probably be sensible, but you may wish to change the title of the legend. Under Title replace the text by Compartment Crop Type. Click OK to close the legend box. Click OK again to close the Create Thematic Map dialogue box.
The compartments should now be filled in with different shadings or colours if you selected that option for each species.
The legend may be hidden behind the mapper window or the browser window. To view it, select the Window menu and Legend of compart_info_now,...,etc. This will bring the legend window to the top. Arrange the windows by resizing and moving them as you wish to display the information best. Finally save the workspace as thematic_now.WOR.
In the final tutorial you will learn how to make predictions based on your management plan and display your predictions using thematic maps.
|
|

