The colour of the solar system planets
What colour do the solar system planets present to the naked eye? I have been working alot in this area recently, and included this question as part of our recent Uranus colour paper.
To convert observed visible spectra of planets to 'true' colour turns out to be a remarkably subtle and nuanced process. The basic elements of colorimetry that need to be known about are covered in my Colorimetry page. In essence, if we know the complete visible spectrum of a planet then we can unambiguously convert these data to true colour as we know how the average human eye responds to such spectra. Hence, observations made with spectral-imaging instruments such as Integral Field Unit (IFU) Spectrometers, where each pixel of the image comprises a continuous visible spectrum at that location, then we can convert it to true colour. Where things get more complicated is for filter-imaging observations, where separate images are made in several diffent wavelength (i.e., different colours) channels and then recombined to give a reconstructed true colour image.
In our recent Uranus colour paper, we analysed observations of Uranus and Neptune made with the Space Telescope Imaging Spectrograph (STIS) and Wide Field Camera 3 (WFC3) instruments on the Hubble Space Telescope (HST), and also observations made with the Multi Unit Spectroscopic Explorer (MUSE) instrument on the Very Large Telescope (VLT) in Chile. We also reanalysed imaging observations made with the Imaging Science System (ISS) on Voyager 2. While STIS is a long-slit spectrometer, observations were made with the slit first centred on the central meridian, and then stepped towards consecutively towards the left side edge, building up an image 'cube' of half the planet. VLT/MUSE, on the other hand, is a true IFU, simultaneously recording continous spectra at each location in its imaging field of view. In contrast, HST/WFC3, and Voyager-2/ISS or filter imagers.
Processing HST/STIS observations of Uranus and Neptune , made in 2002 and 2003 respectively by Erich Karkoschka and his colleagues, we reproduced the true colour of these planets as Figure 7 of our paper, reproduced below.
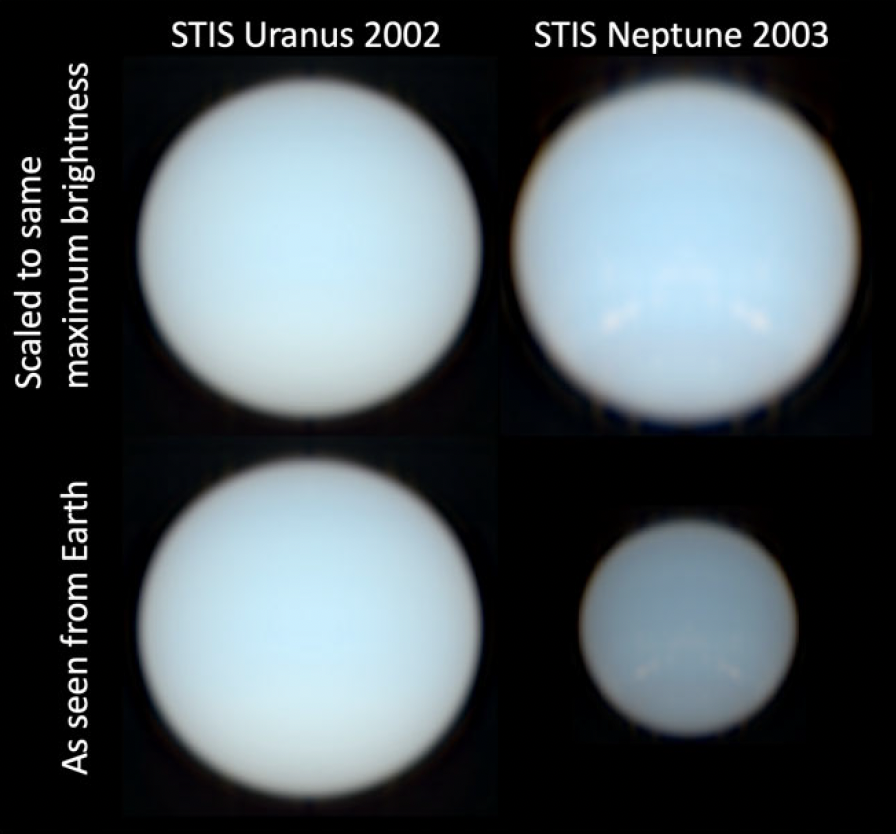
Here, it can be seen that the colours of Uranus and Neptune as seen by HST/STIS in 2002 and 2003 were actually rather similar, and have a very different relative appearance to these planets when looking at many Voyager-2/ISS images that are available on the internet. We show in our Uranus colour paper that the early Voyager-2/ISS images of Neptune were not adjusted for true colour and were much more blue than Neptune's true appearance. While this distinction was made clear at the time, this difference has become lost and misunderstood over time. Our reprocessing of the Voyager images can be seen below.
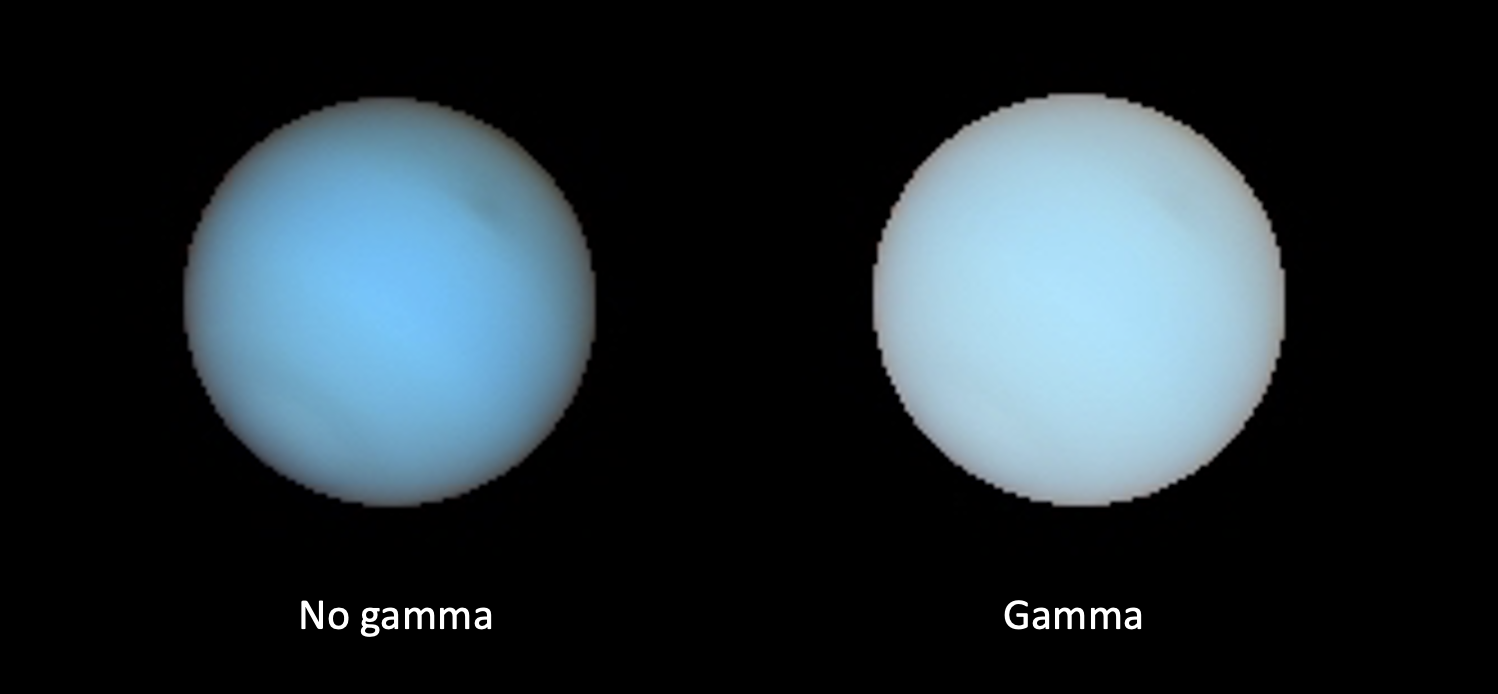
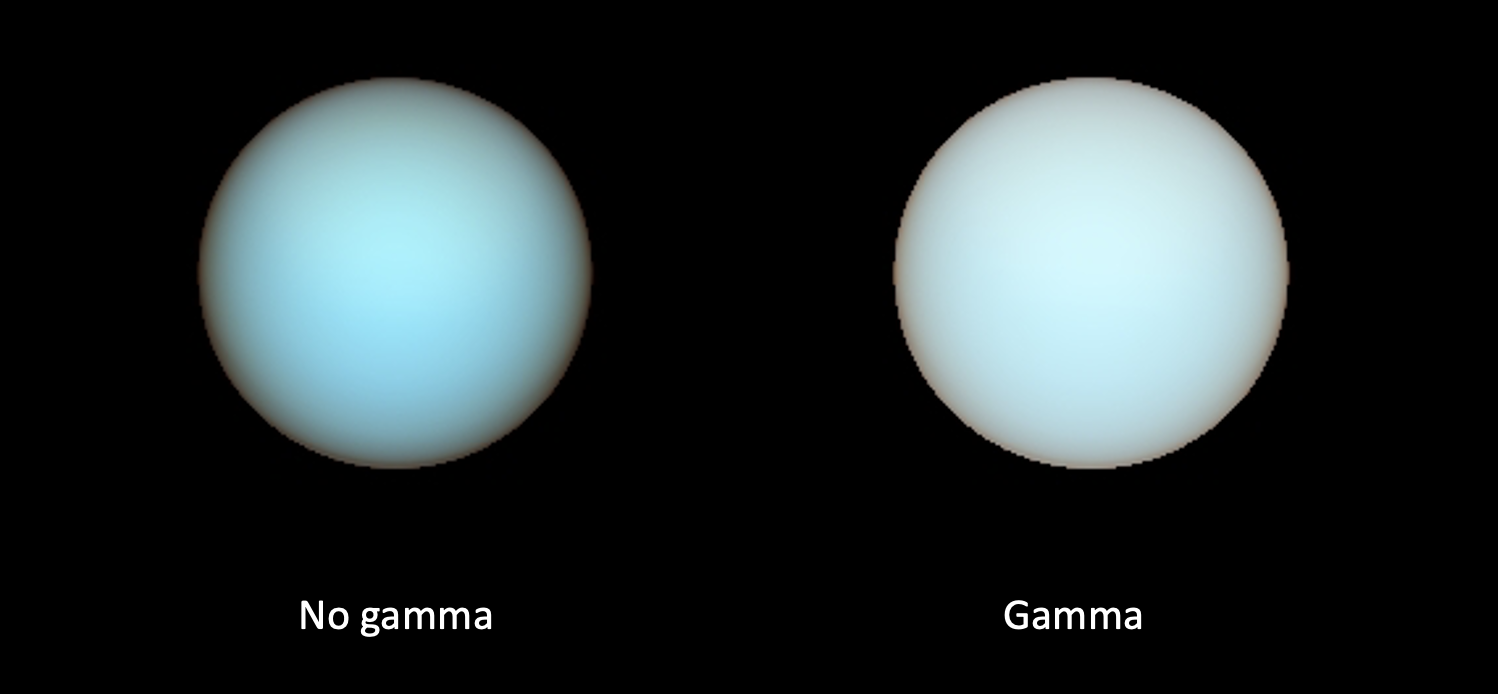
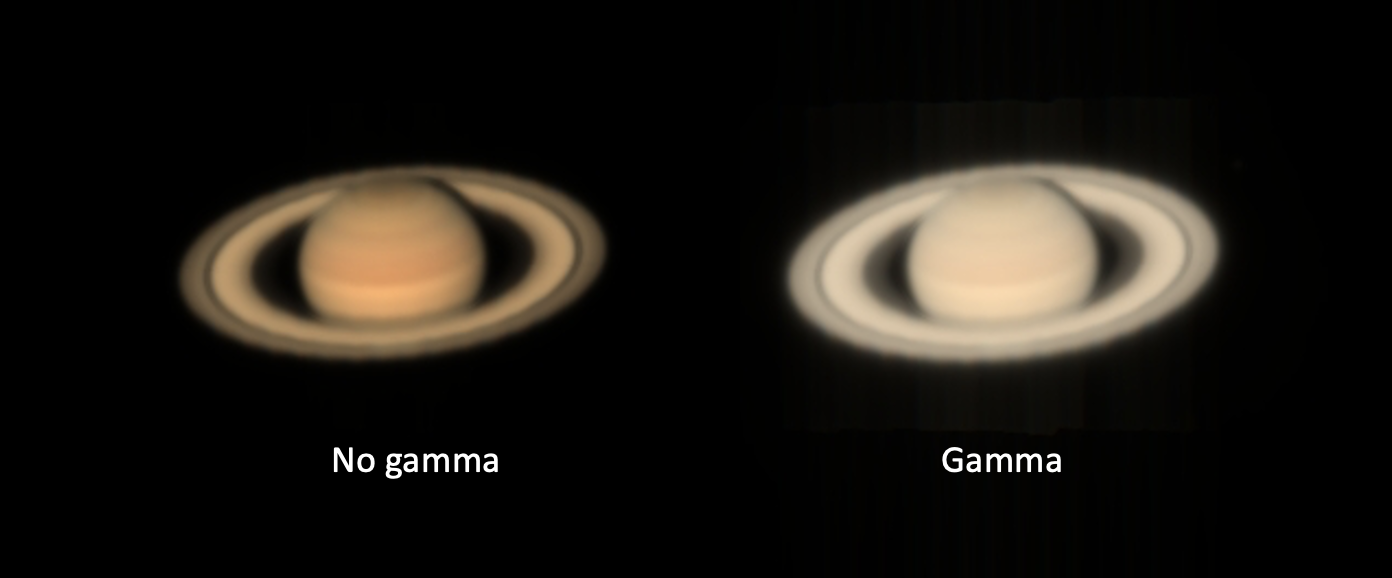
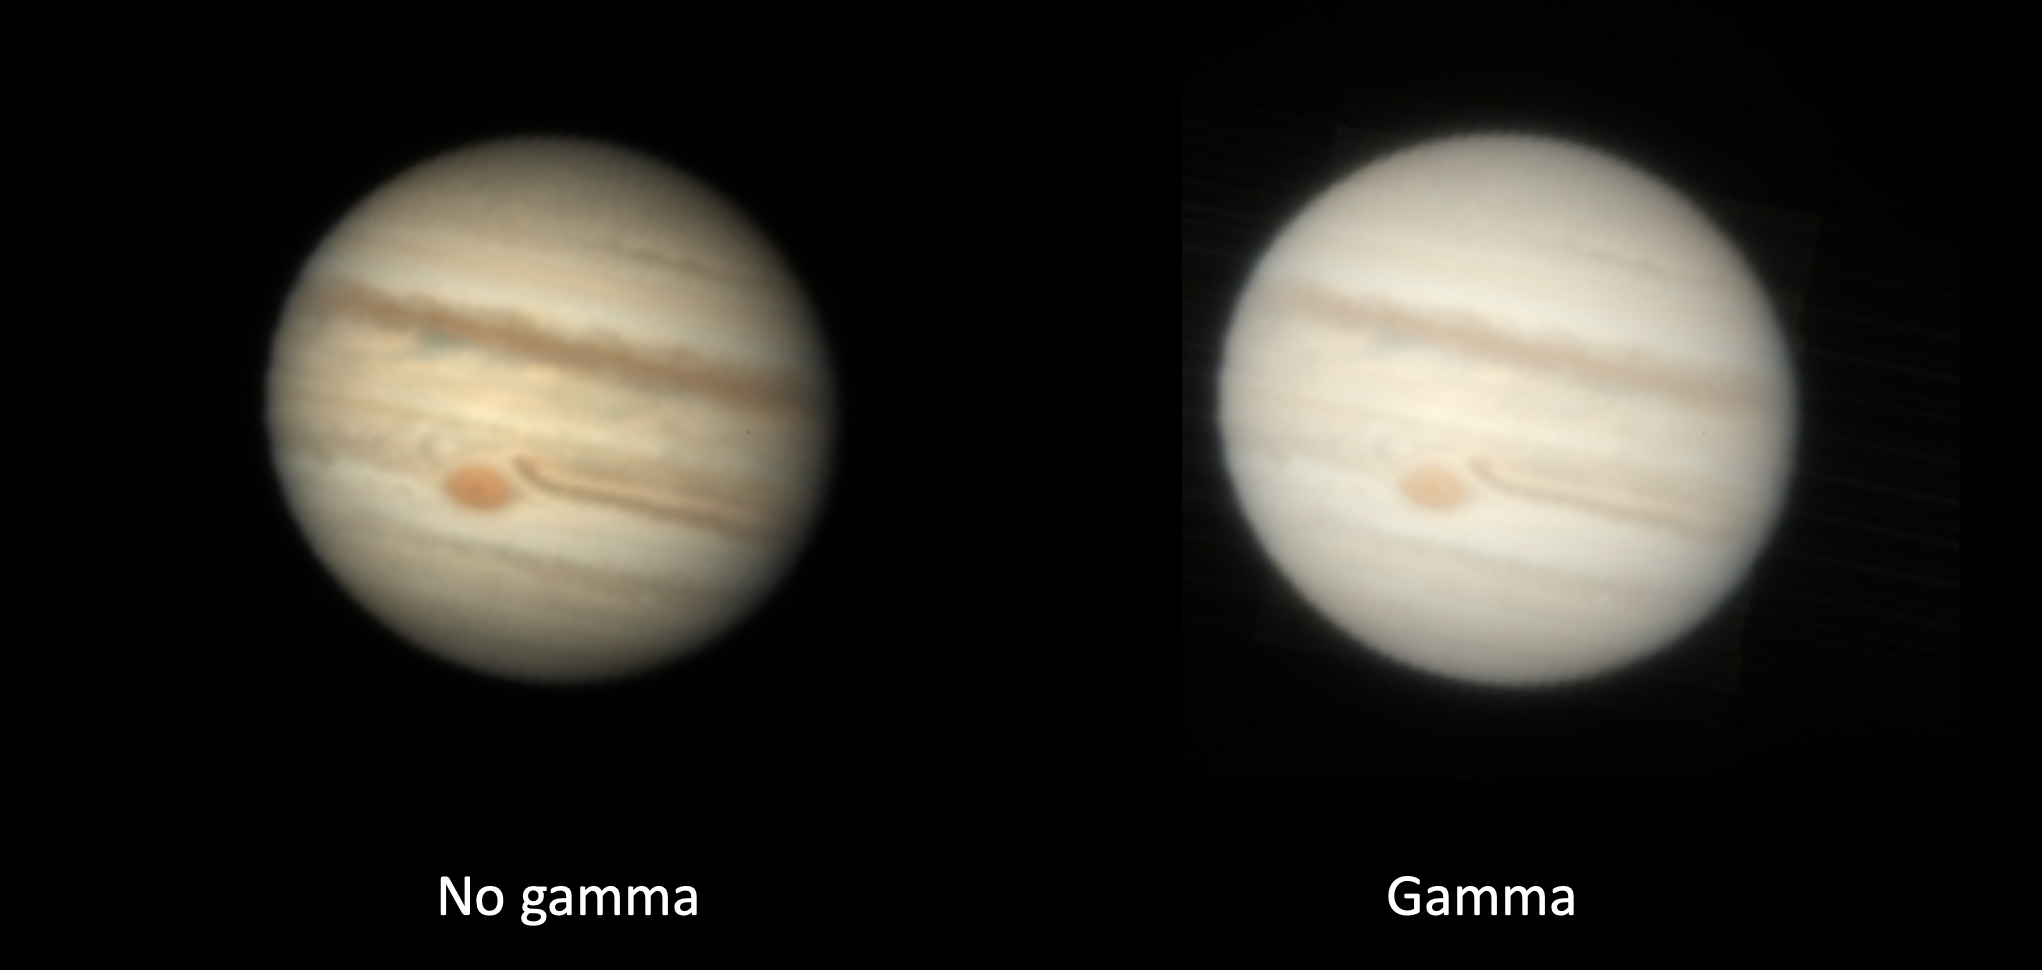
Much of the difference is due to whether the 'Gamma' correction is applied or not. This Gamma correction is explained my fully in the accompanying Colorimetry page. Basically, the light-sensitive cells in the human eye do not respond linearly to light, but instead more logarithmically. This is so we can still see what might be lurking in the shadows on a bright day. Because of this response, it's been found that if digital images are digitised with a linear scale, we see ugly steps in brightness in darker regions of an image. Hence, images are first gamma scaled before being digitised to improve the efficiency of this process. However, for us to see the same image on our computer monitors, this scaling must be corrected for on display. This is something that all computer monitors do, without you even realising it. Hence, if an image that has been digitised linearly is displayed it will have a much higher contrast than the original. It seems to me that this is often done in astronomical images, perhaps accidentally, but it's also the case that non-gamma encoded images just look better and are more colourful. I had often wondered why when I look at planets such as Jupiter through my own back-garden telescope the disc appeared much more pale and bland-looking than the images I'm used to seeing in books and on the internet, and now I think I know why!
To demonstrate this, here are a few colour renditions from VLT/MUSE observations of all the giant planets. The spectral range of MUSE (475 - 933 nm) does not quite cover all blue visible wavelengths so I extended to shortwave, either by scaling HST/STIS observations, or for Jupiter and Saturn, using disc-averaged albedo spectra from Erich Karkoschka. These spectra were also used to fill the gap (578 - 605 nm) reserved for the laser guide star in observatons made with adaptive optics.
Neptune
Uranus
Saturn
Jupiter
For further reading on how colour is percieved by the human eye and properly rendered, the reader may also find this website from Andrew T. Young useful: https://aty.sdsu.edu/explain/optics/color/color.html. In addition, the website of Björn Jónnson is very useful: https://bjj.mmedia.is.