At what sample size do correlation coefficients stabilise?
Let's think for a minute about a different question:
- If I were to repeat the experiment, how similar would the results be?
Try again to generate 1000 samples from the population with ρ = 0.21, but with n=10,50,100
Notice the range of sample r values
If we want our sample correlation r to approximate the population coefficient ρ, it is not sufficient to say either that r is significantly greater than zero, or that the experiment is well powered.
We need a measure of the difference r-ρ.
The simulation above explored how stable the sample correlation coefficients r are (arrr!) given a certain sample size.
Point of Stability
In this paper, Schönbrodt and Perugini (2013) asked:
- How many subjects do I need to get a stable estimate of the correlation coefficient?
They answered the question by simulating a sample, to which they kept incrementally adding more subjects until the sample correlation coefficient r came within an acceptable range of the population coefficient ρ.
Then they asked how many subjects there were at the point r entered the 'corridor of stability'
By repeating this for many samples, they could work out for what sample size the sample correlation r would be acceptably near to the population correlation ρ a certain proportion, say 80%, of the time.
Running the simulation
Select section 4 in the Matlab file CorrelationSim.m and run it
- It will take about 60 seconds to run
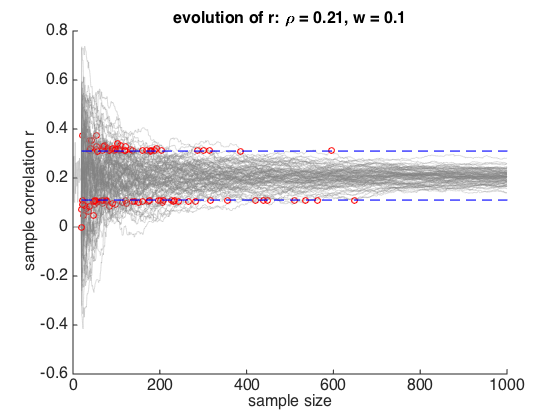
You should see a plot how r evolves with sample size for a large number of simulated samples, as in the paper by Schönbrodt and Perugini (2013)
?
What do the red dots represent?
What about the blue dashed lines?
You should also have a histogram showing the distribution of the Point of Stability.
?For what sample size do you think about 80% of the samples fall within the corridor of stability?
You can find out exactly by
Sort the vector containing he PoS for all samples
The vector contains 100 samples, so if we sort them from smallest to largest, the 80th one will be the sample size for which 80% of samples fall within the corridor of stability
?
How close is close?
The width of the corridor of stability is calculated based on a w-value.
In his classic work on power, Jacob Cohen (1988) suggested that effect sizes of w=0.1, 0.3, 0.5 represented small, medium and large effect sizes for correlation, so a corridor of stability bounded by by w=0.1 (as in the Schönbrodt paper) is allowing for only a small deviation in effect size between the sample and the population
We can be more liberal by defining the corridor of stability using w=0.3 or w=0.5
Try changing w in the Matlab file.
For w=0.3, at what sample size are 80% of simulations within the corridor of stability?