What does a correlation of 0.21 look like?
Firstly, what does a correlation of r=0.21 for 50 subjects look like?
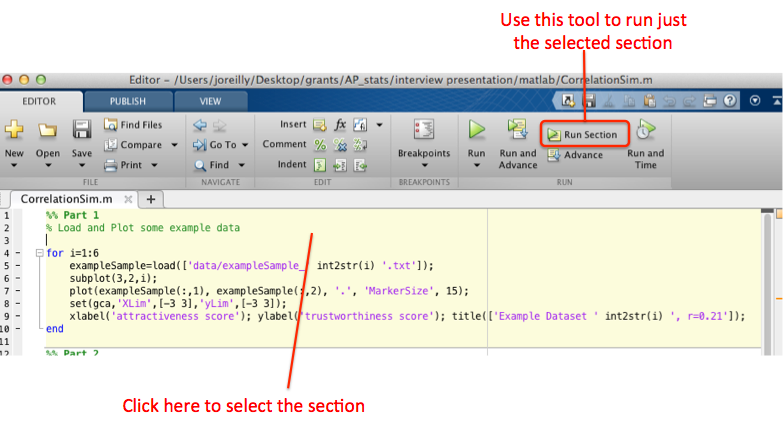
Open the Matlab script CorrelationSim.m
- You have been provided with 6 datasets which each have a correlation of r=0.21
- The script will load and plot these
Run section 1 of the script
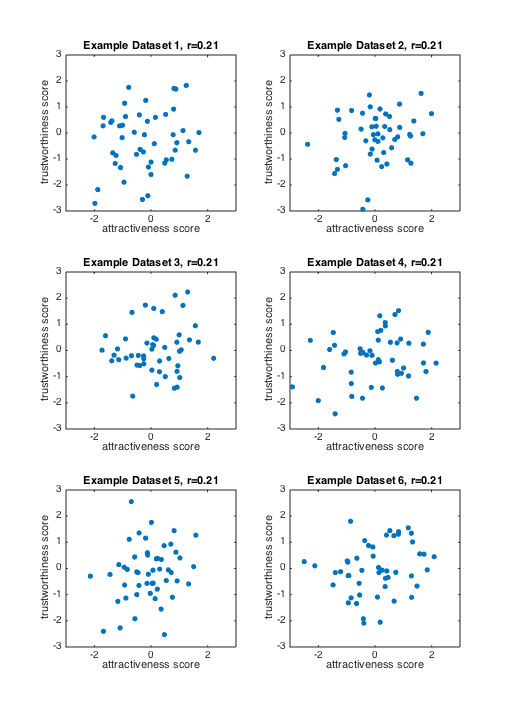
HELP!You should have a figure with 6 panels showing the 6 datasets.
?Just by looking at the data, would you have said there was a relationship?