Is it reliable?
Let's think for a minute about a different question:
- If I were to repeat the experiment, how similar would the results be?
Go to the Matlab script CorrelationSim.m
- Select Section 2 and run this section
You have just generated a population of data pairs (x,y) or (attractiveness, trustworthiness) with true correlation coefficient ρ = 0.21
Now we are going to draw lots of samples of size n from that population and work out the sample correlation coefficient r in each sample
- Select and run Section 3 of CorrelationSim.m
How many samples did you generate? Look at the code!
Change the number of samples to 10000 and run it again.
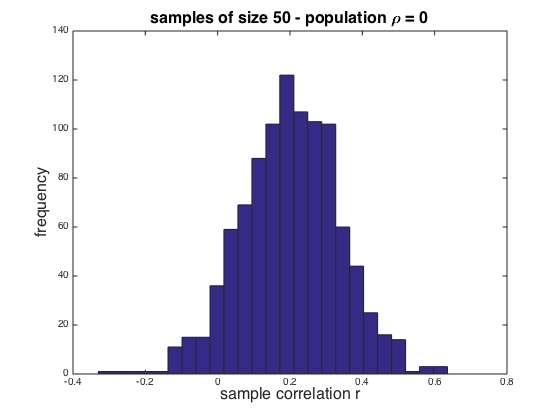
You should have a figure containing a histogram of the sample correlation coefficients for each of the 10000 samples.
?So - given that the true correlation ρ = 0.21, you can observe quite a range of sample correlation coefficients.
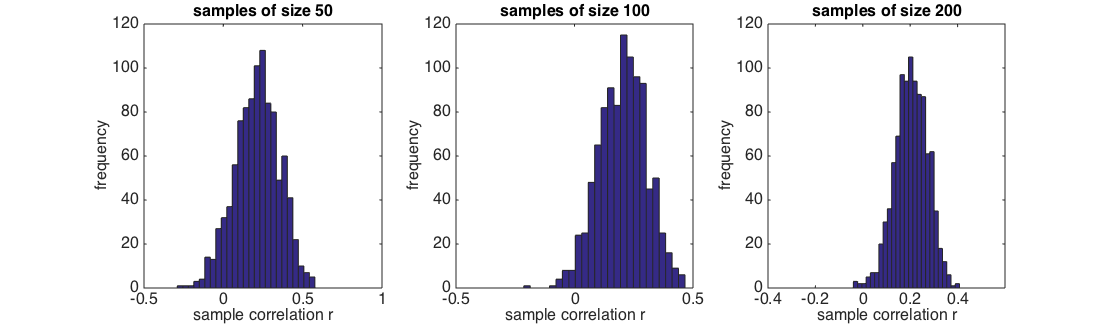
What do you think you could change to get a narrower range?
?